
Framedash’s in-editor 3D heatmap places recorded events back into the level where they occurred. In Unity, Unreal Engine 5, and Godot (C#), translucent boxes make it easier to inspect event concentrations around a staircase, a doorway, or overlapping floors without translating everything from a top-down map.
The colors need one qualification up front: the current editor overlay is colored by event count. The dashboard offers separate performance-metric views, but the SDK editor controls do not select FPS, frame time, GPU time, or memory as their color metric. A red voxel tells you that more events were recorded there within the fetched data. It does not establish a performance problem.
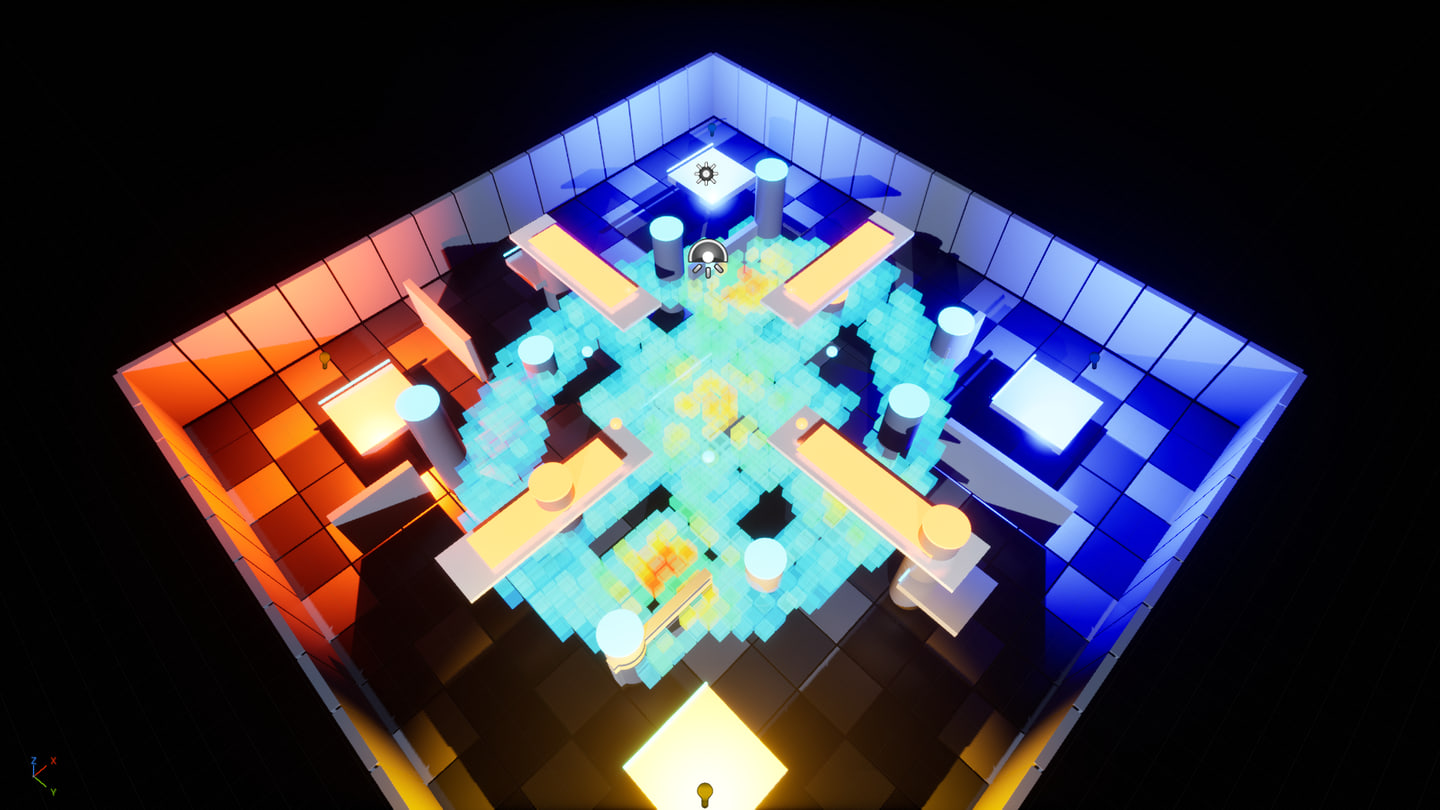
What a voxel represents
A voxel is a small box representing one aggregated grid cell. The editor requests XYZ aggregation from the API and draws each cell at its grid coordinates. It shows the distribution of events, not individual event positions or a replay of a session.
Grouping on all three axes helps separate events in spaces that overlap in a flat view. For example, events on a balcony and in the atrium below can occupy different cells if the cell size is fine enough. A coarse grid can still merge them. Older API responses without z remain visible as flat cells at the configured map floor.
The five-stop blue-to-red palette is relative to the largest weight in the response. For the current editor endpoint, that weight is the event count. Unity and Godot display the cell count and maximum weight alongside the legend. Check those numbers before comparing screenshots: a red cell in one fetch need not contain the same number of events as a red cell in another.
Each fetch returns at most 10,000 cells, ordered by descending weight. If you reach that limit, some lower-count cells may be missing. Try a shorter period, an event-name filter, or a larger cell size. An empty area can also mean that no qualifying events were recorded there; it is not evidence that the area runs well.
The editor reads aggregated API data. It does not replay a local capture file.
Prepare the data and read access
The overlay needs events with a non-empty map_id and meaningful world coordinates, plus a matching map registered in Framedash. Check the map’s world bounds as well: events outside those bounds are excluded. If you already send suitable events, you can use them without adding another capture path. The automatic perf_heartbeat has an empty map_id and no position, so heartbeats alone do not populate this grid.
Use a Read API Key with the analytics:read scope and the corresponding Project ID. This key is separate from the game’s write-only ingest key. To avoid saving a read key in editor settings, set FRAMEDASH_ANALYTICS_API_KEY before launching the editor and leave the explicit key field empty. All three SDKs support this fallback; an explicitly configured key takes precedence.
Treat a read key as a credential even though it cannot ingest events. Keep it out of source control, exported games, logs, and screenshots. Use the API base URL for the deployment that holds your data.
Open the heatmap in your engine
The following controls were released in the July 24, 2026 SDK updates: Unity 0.1.7, UE5 0.1.13, and Godot 0.1.8. These are the versions that introduced the behavior described here, not a list of the latest SDK versions.
Unity SceneView
- Open Window > Framedash Heatmap and set the read key, Project ID, and API base URL.
- Refresh the map list, select a map, and choose the period, cell size, and optional event-name filter. Click Fetch outside Play mode.
- In the SceneView’s Framedash Heatmap overlay, use Show to toggle the cells, Frame to fit the view to the data, and Controls to reopen the settings.
Closing the controls window leaves the overlay available. The selected map and display preference persist per project, and the overlay is hidden during Play mode.
Unity’s recorded Vector3 components map directly to SceneView X/Y/Z. The overlay does not swap axes to create a ground plane. Z Offset changes only the display position; it does not correct or rewrite the stored coordinates.
Unreal Engine 5 level viewports
Set the API URL, Project ID, read key, and display settings under Project Settings > Plugins > Framedash Heatmap. Open Window > Framedash > Framedash Heatmap, select the map and query settings, and fetch outside Play In Editor (PIE).
Then enable Show > Framedash Heatmap in each level viewport where you want the overlay. The flag is off by default and independent per viewport, so you can leave one view clear for editing. Closing the data panel does not remove the fetched overlay.
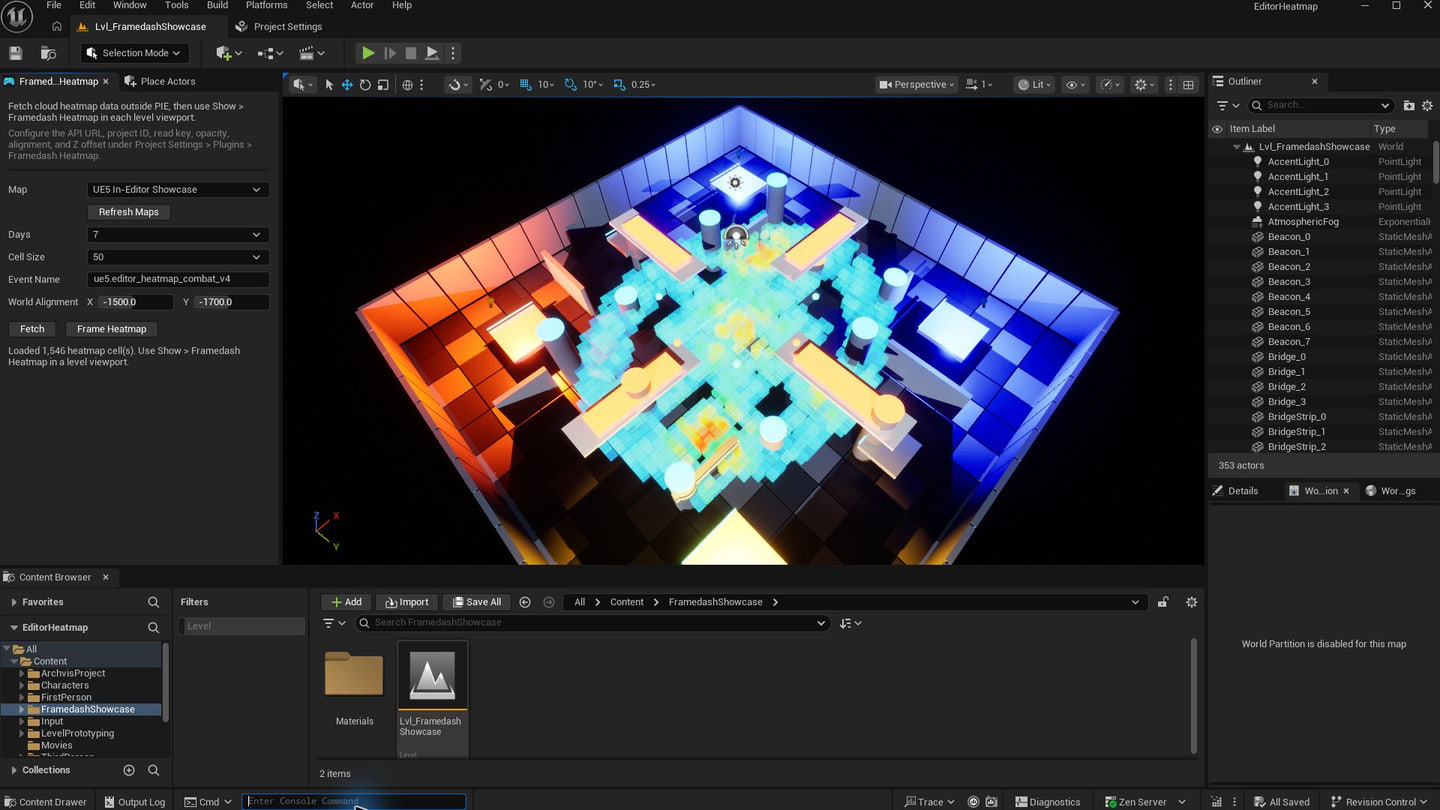
Both standard F9 and high-resolution viewport screenshots include the heatmap. When attaching one to an issue, record the map, period, cell size, and event filter with it so another developer can interpret the colors. PIE suspends the display and restores the previous viewport choices afterward.
Godot (C#) 3D editor
With the C# addon built and enabled, open the Framedash Heatmap dock. Enter the read key, Project ID, and API base URL, then choose the period and cell size. Use Refresh Maps, select a map, and click Fetch Heatmap. Enable Show and use Frame Heatmap to position the 3D editor camera around the loaded cells.
The dock also offers an event-name filter, opacity, and Z offset. It renders the cells as a cached translucent mesh and hides the overlay while the game is running. Settings live in per-project editor metadata under .godot/editor/editor_layout.cfg; keep .godot/ out of version control. The heatmap code is editor-only.
Use the overlay during a performance investigation
The dashboard and editor provide different views of the recorded data. Keep their query scopes distinct: the current editor controls filter by map, period, cell size, and event name. They do not inherit the dashboard’s build, platform, or performance-metric selection.
For a performance investigation, use this sequence:
- In the dashboard, select a map, a build, and the relevant platform and period. Inspect the recorded performance metric and its values. The heatmap shows one build at a time; the Regression page provides the numeric baseline/candidate comparison.
- Open the corresponding level and fetch the editor’s event view. Use it to understand where your instrumentation recorded activity. If the selected period includes several builds or platforms, do not treat those voxels as a view of only the dashboard’s selected build.
- Reproduce the suspect route or scene in a suitable measurement build and capture it with the engine profiler. Investigate the rendering work, scripts, or allocations indicated by that capture. A voxel near an asset does not attribute cost to that asset.
- After a change, repeat the measurement under comparable conditions. Keep the device, settings, route, and capture boundaries consistent, and compare the measured values. A cooler editor overlay can result from fewer events or a different relative maximum; it does not verify a fix.
Event density also depends on where and how often you emit events. A death-event heatmap describes recorded deaths. A periodically sampled position event describes sampled activity. Neither is automatically a time-spent map, and changing the sampling rate changes the evidence available for comparison.
If the view is empty or misplaced
Check the Project ID and key scope first, then the registered map ID, time window, and event-name filter. Confirm that events arrived with the intended coordinates and fall inside the map bounds. Use Frame or Frame Heatmap to locate the loaded data, and verify that the display toggle is enabled outside play mode.
For a shifted overlay, compare the level’s coordinate system with the recorded coordinates before adjusting the display offset. If the level geometry moved since the events were recorded, the old cells can be correctly positioned for the old layout and still look wrong in the current scene.
Start with one map and one known event type whose position you can verify. Once that appears in the expected place, widen the query.
- See Performance Heatmaps for dashboard metrics and filtering.
- Follow the Unity, Unreal, or Godot guide for SDK installation and configuration.