
Eliminate your
performance blind spots.
From in-game heatmaps to build-by-build regression analysis. A full-stack telemetry platform built for games.
- Unity 2022.3+
- Unreal Engine 5.3+
- Godot 4.3+ C#
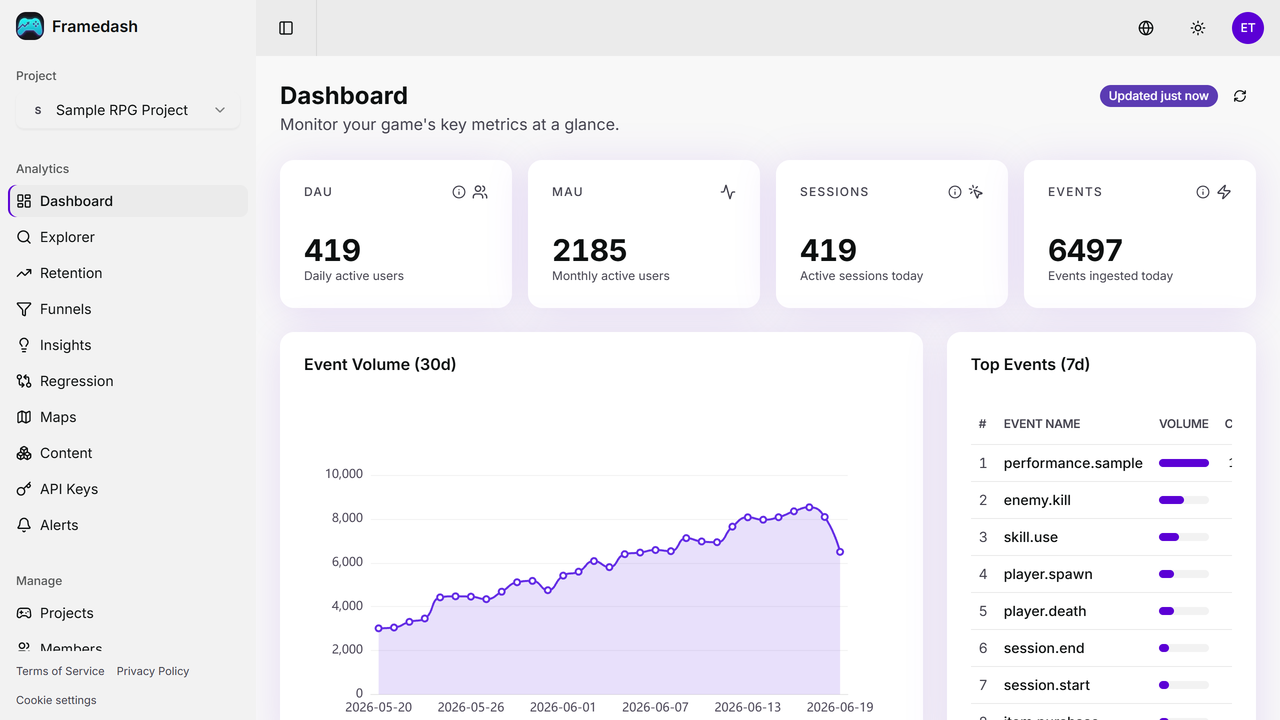
From SDK to dashboard, integrated straight into your game dev stack
Touch a real performance heatmap.
Drag across this sample game map and inspect frame time, player density, and combat deaths cell by cell. The same dashboard you get on day one, running on sample data right here in your browser.
These become your heatmaps the day you connect the SDK.
Get Started FreeGame-context analysis that generic APM can't reach
Frame time, GPU, memory, player behavior. Telemetry tied to game context, in the language engineers speak.
Performance Heatmaps
Overlay FPS, frame time, GPU time, and memory usage cell-by-cell on your game map. Filter by device or build profile and spot hotspots at a glance.
Build Regression Analysis
Compare frame time, GPU time, and memory across build IDs to review regressions before release.
Automated Map Capture
Upload captured map images with world-coordinate metadata from CI or local tools. No manual dashboard setup needed.
Content Registry
Link static metadata for maps, items, and skills to your telemetry. Analyze by name, not by ID.
Developer Platform
REST API + CLI + MCP Server. Query with SQL, embed in CI/CD, and connect LLM tools.
Fully Localized
UI and docs available in English, Japanese, Korean, and Chinese (Simplified & Traditional). A professional-grade game telemetry SaaS, localized for studios worldwide.
How Framedash differs from generic tools
Unity Analytics, GameAnalytics, and Sentry are all excellent tools with a different focus. Framedash specializes in game performance telemetry tied to map coordinates and builds.
| Capability | Framedash | Unity Analytics | GameAnalytics | Sentry |
|---|---|---|---|---|
| Primary focus | Game-focused performance telemetry | Player behavior analytics | Player behavior analytics & FPS reports | Error/crash monitoring & tracing |
| Engine support | Unity / UE5 / Godot (C#) | Unity (REST API for others) | Unity / UE & many more | Unity / UE / Godot & many more |
| Performance heatmaps on map coordinates | Offered | Not listed in official docs | Not listed in official docs | Not listed in official docs |
| Frame time / GPU / memory comparison across builds | Offered | Not listed in official docs | FPS / memory via Health | Slow/frozen frames (mobile) |
| Funnel & retention analysis | Offered | Offered | Offered | Not listed in official docs |
Based on each vendor's official site and documentation as of July 2026. An em dash means the capability is not listed in the vendor's official docs.
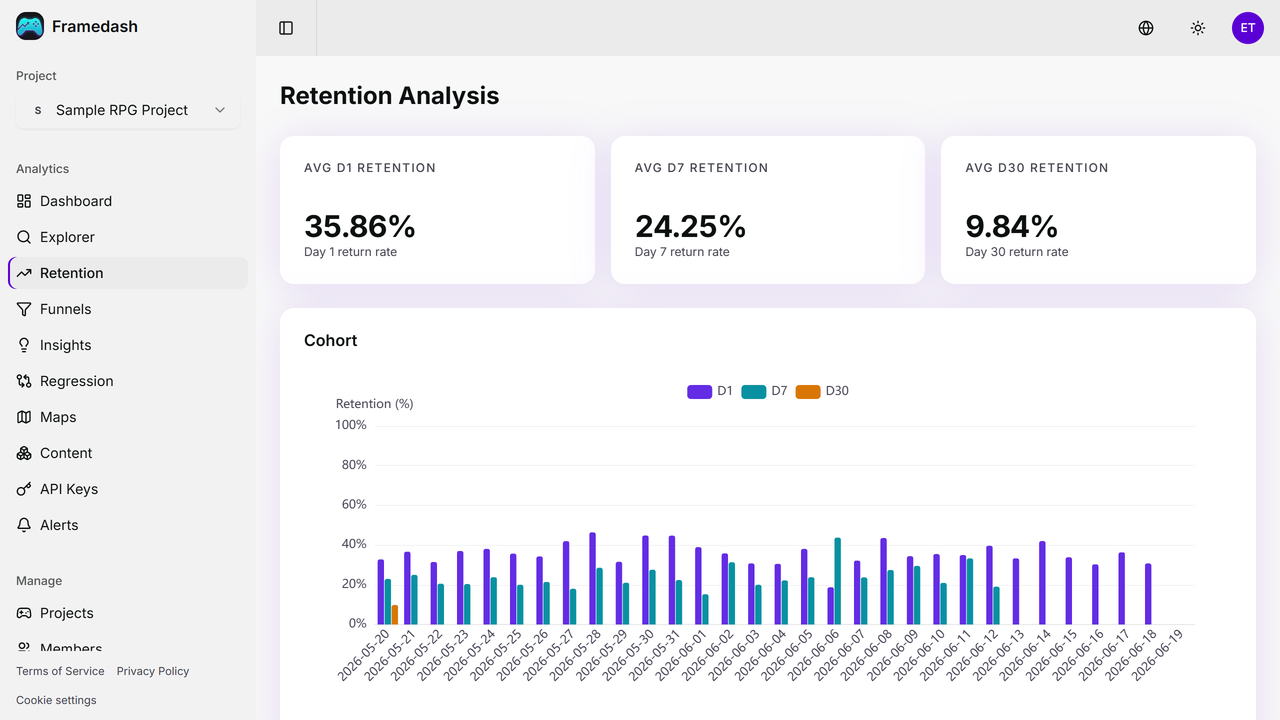
Know exactly when players churn.
D1 / D7 / D30 cohort curves computed automatically. Track how updates and events affected retention by daily cohort.
- Visualize cohort retention day by day
- Measured on the same event foundation as funnels and insights
Review worsened P95 builds before release.
Compare frame time, GPU time, and memory across build IDs, then use threshold alerts to notify Slack, email, or webhooks.
- Compare metrics between builds (60fps target)
- Threshold alerts to Slack / email / webhook
- Map and platform filters narrow each review
From SDK integration to insight in as little as 5 minutes
Integrate the SDK
Add the SDK to your Unity, UE5, or Godot (C#) project. Start sending telemetry with just a few lines of code.
// Unity (C#)
using Framedash;
using UnityEngine;

public class Telemetry : MonoBehaviour {
  void Start() {
    TelemetrySDK.Initialize(
      apiKey: "fd_8a72c4f0…",
      buildId: Application.version);
    TelemetrySDK.Instance.Track("level_start");
  }
}
Visualize Your Data
Monitor FPS, memory, and player behavior in real time. Heatmaps on your game map make insights intuitive.
// Protobuf over HTTPS
→ Cloudflare Workers
→ ClickHouse (OLAP)
→ Dashboard

981 events ingested / today
Detect Issues Instantly
Compare captured build telemetry and configure threshold alerts for performance regressions.
# build comparison
framedash query "SELECT build_id,
  quantile(0.95)(frame_time_ms) AS p95_ms
  FROM events GROUP BY build_id"

P95 frame time
  16ms → 24ms  REVIEW
alert → Slack #perf
Start now on Free
Upgrade as your team grows. All prices monthly, tax included.
- 1 project
- 1 billable seat
- 1 alert (Webhook)
- API 100 req/hr
- Community support
- 3 projects
- 3 billable seats
- 5 alerts (Email + Webhook)
- API 500 req/hr
- Email support
- 5 projects
- 5 billable seats
- 10 alerts (Email + Webhook + Slack)
- API 2K req/hr
- Priority support
- Unlimited projects
- 50 billable seats
- 30 alerts (Email + Webhook + Slack)
- API 10K req/hr
- Dedicated support
- Unlimited projects
- Unlimited billable seats
- Unlimited alerts (Email + Webhook + Slack)
- API Unlimited
- Dedicated customer success
- SSO / SAML
- Data residency
- SLA guarantee
- Onboarding assistance
- Performance Heatmaps
- Build Regression Dashboard
- Build Regression Detection
- Funnel & Retention Analysis
- Automated Map Capture / Content Registry
- Developer Platform (REST API / CLI / MCP)
Get started for free today
No credit card required. Integrate the SDK on the Free plan and see your first heatmap in 5 minutes.
Get Started Free